Nifty 50 5mint Strategy
The script defines a specific trading session based on user inputs. This session is specified by a time range (e.g., "1000-1510") and selected days of the week (e.g., Monday to Friday). This session definition is crucial for trading only during specific times.
Lookback and Breakout Conditions:
The script uses a lookback period and the highest high and lowest low values to determine potential breakout points. The lookback period is user-defined (default is 10 periods).
The script also uses Bollinger Bands (BB) to identify potential breakout conditions. Users can enable or disable BB crossover conditions. BB consists of an upper and lower band, with the basis.
Additionally, the script uses Dema (Double Exponential Moving Average) and VWAP (Volume Weighted Average Price) . Users can enable or disable this condition.
Buy and Sell Conditions:
Buy conditions are met when the close price exceeds the highest high within the specified lookback period, Bollinger Bands conditions are satisfied, Dema-VWAP conditions are met, and the script is within the defined trading session.
Sell conditions are met when the close price falls below the lowest low within the lookback period, Bollinger Bands conditions are satisfied, Dema-VWAP conditions are met, and the script is within the defined trading session.
When either condition is met, it triggers a "long" or "short" position entry.
Trailing Stop Loss (TSL):
Users can choose between fixed points ( SL by points ) or trailing stop (Profit Trail).
For fixed points, users specify the number of points for the stop loss. A fixed stop loss is set at a certain distance from the entry price if a position is opened.
For Profit Trail, users can enable or disable this feature. If enabled, the script uses a "trail factor" (lookback period) to determine when to adjust the stop loss.
If the price moves in the direction of the trade and reaches a certain level (determined by the trail factor), the stop loss is adjusted, trailing behind the price to lock in profits.
If the close price falls below a certain level (lowest low within the trail factor(lookback)), and a position is open, the "long" position is closed (strategy.close("long")).
If the close price exceeds a certain level (highest high within the specified trail factor(lookback)), and a position is open, the "short" position is closed (strategy.close("short")).
Positions are also closed if they are open outside of the defined trading session.
Background Color:
The script changes the background color of the chart to indicate buy (green) and sell (red) signals, making it visually clear when the strategy conditions are met.
In summary, this script implements a breakout trading strategy with various customizable conditions, including Bollinger Bands, Dema-VWAP crossovers, and session-specific rules. It also includes options for setting stop losses and trailing stop losses to manage risk and lock in profits. The "trail factor" helps adjust trailing stops dynamically based on recent price movements. Positions are closed under certain conditions to manage risk and ensure compliance with the defined trading session.
CE=Buy, CE_SL=stoploss_buy, tCsl=Trailing Stop_buy.
PE=sell, PE_SL= stoploss_sell, tpsl=Trailing Stop_sell.
Remember that trading involves inherent risks, and past performance is not indicative of future results. Exercise caution, manage risk diligently, and consider the advice of financial experts when using this script or any trading strategy.
Cari dalam skrip untuk "THE SCRIPT"

20MA / 200 MA Konvergenz & Elephant Bar FilterThe script creates a Momentum Filter designed to identify stocks that are currently exhibiting a transition from long-term price stability to short-term explosive volatility.
1. 🧘 Long-Term Stability Logic (Convergence)
The first part of the script identifies assets in a state of tight consolidation. This suggests that market participants have reached a temporary equilibrium, creating pent-up energy for a future trend.
A. Moving Average (MA) Proximity
The script checks if the fast MA (20 periods) and the slow MA (200 periods) are very close together.
It calculates the percentage difference, filtering for stocks where the separation between the two MAs is less than 2%. This defines the narrow range.
This condition confirms that the short-term and long-term price trends are essentially flat and aligned.
B. Price Nearness to the Long-Term MA
It further ensures that the current closing price is also within a tight range (e.g., less than 2%) of the 200-period MA.
This confirms the asset is actively trading at the center of the consolidation zone, simulating the "parallel" alignment of the MAs.
2. 💥 Explosive Breakout Logic (The Large Candle)
The second part of the script looks for the catalyst—an event that signals a sudden shift in supply and demand, ending the period of calm.
A. Above-Average Body Size
The script calculates the average absolute size of the candle body (the distance between open and close) over the last 20 periods.
It filters for stocks where the current candle body is at least three times (3x) larger than that historical average. This is the core signal of a powerful, convinced price move.
B. High Body-to-Range Ratio
To ensure the move was decisive and met little resistance, the script verifies that the candle body accounts for at least 85% of the candle's total range (high minus low).
This eliminates candles with long wicks (shadows), which would indicate volatility but a lack of directional conviction.
🎯 Summary
The combined screening identifies assets that have maintained long-term stability (MA convergence) but have just experienced a high-conviction, low-resistance breakout (Large Candle), indicating that a new, strong trend may be initiating.

Whale Supertrend (V1.2)The script "Whale Supertrend (V1.2)" is an advanced trend indicator that uses multiple Supertrends with different factors to determine entry and exit points in the market. The Supertrend is a popular indicator that combines price and volatility to help identify trend direction. The script displays buy and sell signals based on the confluence of Supertrends.
How the script works
Configuring Supertrends
The script configures six Supertrends with different factors (factor, factor1, factor2, factor3, factor4, factor5) while using the same ATR period (atrPeriod = 10).
Supertrend 1: factor = 3
Supertrend 2: factor1 = 4
Supertrend 3: factor2 = 6
Supertrend 4: factor3 = 9
Supertrend 5: factor4 = 13
Supertrend 6: factor5 = 18
For each Supertrend, the bullish (blue) and bearish (purple) trend conditions are plotted on the chart.
Signal Calculation
The script calculates the number of Supertrends in bullish and bearish trend:
bullishCount: Number of Supertrends indicating a bullish trend.
bearishCount: Number of Supertrends indicating a bearish trend.
Signal Detection
The script triggers a buy or sell signal when at least three of the six Supertrends indicate the same trend:
Buy Signal (buySignal): Triggers when bullishCount is greater than or equal to 3.
Sell Signal (sellSignal): Triggers when bearishCount is greater than or equal to 3.
To avoid repetition, signals are only displayed when the state changes:
triggerBuy: Buy signal only when buySignal becomes true for the first time.
triggerSell: Sell signal only when sellSignal becomes true for the first time.
Candle Coloring:
Candles now change color based on signals:
Green: When a Buy Signal is active.
Red: When a Sell Signal is active.
This provides a clearer visualization of market trends directly on the chart.
Dynamic Settings for Supertrends:
You can customize the ATR Period and Factor for each of the 6 Supertrends via the settings panel.
Each Supertrend has independent parameters:
ATR Period: Controls the ATR calculation period.
Factor: Adjusts the Supertrend sensitivity.
Benefits:
Enhanced Readability: Candle colors help identify buy and sell zones at a glance.
Greater Customization: Tailor Supertrend settings to your trading strategy or market conditions.

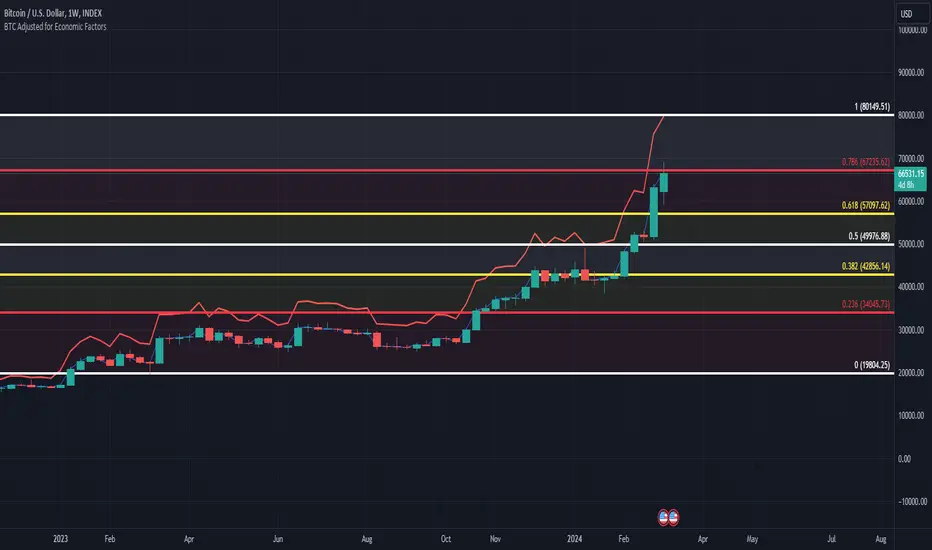
BTC/USD Inflation priced in! ~Period 2009 - 2023 (by TAS)The script creates a custom indicator titled "BTC Adjusted for Economic Factors.
Adjusted BTC Price is plotted in red, making it more prominent. The adjusted price is Bitcoin's historical closing prices adjusted for cumulative inflation over time, based on the Core Consumer Price Index (CPI) annual inflation rates from 2009 onwards.
The script calculates the adjusted price of Bitcoin by taking into account the effect of inflation on its value. It uses annual CPI rates for each year from 2009 to 2022 to calculate a cumulative inflation factor. The script assumes a placeholder inflation rate of 2.5% for 2023, indicating that this value should be updated when the actual rate is available. The script suggests adding CPI rates for additional years as they become available to maintain the accuracy of the adjustment.
Here's a breakdown of how the script works:
Core CPI Annual Inflation Rates: It starts by defining the annual inflation rates for each year from 2009 to 2022, expressed as a percentage divided by 100 to convert to a decimal.
Cumulative Inflation Calculation: The script calculates cumulative inflation starting from the year 2009 up to the current year. For each year that has passed since 2009, it multiplies the cumulative inflation factor by (1 + cpiRate), where cpiRate is the inflation rate for that year. This effectively compounds the inflation rate over time.
Adjusting Bitcoin's Price: The script then adjusts Bitcoin's closing price (close) for the calculated cumulative inflation to get the adjusted price (adjustedPrice).
Plotting the Prices: Finally, it plots both the original and the adjusted Bitcoin prices on the chart, allowing users to visually compare how inflation has theoretically impacted Bitcoin's value over time.
--------------------------------------------------------------------------------------------------
Important to notice, Fib. Retracements from the 2017 cycle top to the recent top (¬80K) doesn't look invalidated.
--------------------------------------------------------------------------------------------------
Inputs and feedback are welcome!
OrangeCandle 4EMA 55 + Fib Bands + SignalsThe script is a TradingView indicator that combines three popular technical analysis tools: Exponential Moving Averages (EMAs), Fibonacci bands, and buy/sell signals based on these indicators. Here’s a breakdown of its features:
1. EMA Settings and Calculation:
The script calculates and plots several Exponential Moving Averages (EMAs) on the chart with different lengths:
Short-term EMAs: EMA 9, EMA 13, EMA 21, and EMA 55 (used for tracking short-term price trends).
Long-term EMAs: EMA 100 and EMA 200 (used to analyze longer-term trends).
These EMAs are plotted with different colors to visually distinguish between the short-term and long-term trends.
2. Fibonacci Bands:
The script calculates Fibonacci Bands based on the Average True Range (ATR) and a Simple Moving Average (SMA).
Fibonacci factors (1.618, 2.618, 4.236, 6.854, and 11.090) are used to determine the upper and lower bounds of five Fibonacci bands.
Upper Fibonacci Bands (e.g., fib1u, fib2u) represent resistance levels.
Lower Fibonacci Bands (e.g., fib1l, fib2l) represent support levels.
These bands are plotted with different colors for each level, helping traders identify potential price reversal zones.
3. Buy and Sell Signals:
Long Condition: A buy signal occurs when the price crosses above the EMA 55 (long-term trend indicator) and is above the lower Fibonacci band (support zone).
Short Condition: A sell signal occurs when the price crosses below the EMA 55 and is below the upper Fibonacci band (resistance zone).
These conditions trigger visual signals on the chart (green arrow for long, red arrow for short).
4. Alerts:
The script includes alert conditions to notify the trader when a long or short signal is triggered based on the crossover of price and EMA 55 near the Fibonacci support or resistance levels.
Long Entry Alert: Triggers when the price crosses above the EMA 55 and is near a Fibonacci support level.
Short Entry Alert: Triggers when the price crosses below the EMA 55 and is near a Fibonacci resistance level.
5. Visualization:
EMAs are plotted with distinct colors:
EMA 9 is aqua,
EMA 13 is purple,
EMA 21 is orange,
EMA 55 is blue (with thicker line width for emphasis),
EMA 100 is gray,
EMA 200 is black.
Fibonacci bands are plotted with different colors for each level:
Fib Band 1 (upper and lower) in white,
Fib Band 2 in green (upper) and red (lower),
Fib Band 3 in green (upper) and red (lower),
Fib Band 4 in blue (upper) and orange (lower),
Fib Band 5 in purple (upper) and yellow (lower).
Summary:
This script provides a comprehensive strategy for analyzing the market with multiple EMAs for trend detection, Fibonacci bands for support/resistance, and signals based on price action in relation to these indicators. The combination of these tools can assist traders in making more informed decisions by providing potential entry and exit points on the chart.

Harish Algo 2The script "Harish Algo 2" is a Pine Script-based TradingView indicator that automatically identifies significant trendlines based on fractal points and tracks price interactions with those trendlines. Key features include:
Fractal Detection: The script identifies fractal highs and lows, using a configurable fractal period, to serve as pivot points for generating trendlines. Fractal highs are marked in blue, and fractal lows are marked in red.
Dynamic Trendlines: It draws trendlines between consecutive fractal points, with a limit on the maximum number of active trendlines. The trendlines can be extended either in both directions or to the right, as per user input. The line width can also be customized.
Support/Resistance Counting: Each trendline tracks how many times the price interacts with it. If the price approaches the line from above and touches or stays near it, the line is considered a support. If the price approaches from below, it is considered a resistance. These counts are used to modify the trendline's color and appearance.
Trendlines with 2 support interactions turn green.
Trendlines with 2 resistance interactions turn red.
Trendlines with 3 or more interactions turn black.
Trendline Styling: Trendlines that extend over a long period (more than 100 bars) change to a dotted style to highlight their persistence.
Break Detection: The script monitors if the price crosses a trendline, signaling a potential breakout or breakdown. Once a trendline is broken, it stops extending further.
Trendline Removal: The script ensures that only a limited number of trendlines are active at a time. If the maximum number of trendlines is reached, the oldest trendline is removed to make space for new ones.
This indicator is designed to help traders visualize important trendlines, spot potential support and resistance levels, and detect breakouts or breakdowns based on price movement.

Nadaraya-Watson Probability [Yosiet]The script calculates and displays probability bands around price movements, offering insights into potential market trends.
Setting Up the Script
Window Size: Determines the length of the window for the Nadaraya-Watson estimation. A larger window smooths the data more but might lag current market conditions.
Bandwidth: Controls the bandwidth for the kernel regression, affecting the smoothness of the probability bands.
Reading the Data Table
The script dynamically updates a table positioned at the bottom right of your chart, providing real-time insights into market probabilities. Here's how to interpret the table:
Table Columns: The table is organized into three columns:
Up: Indicates the probability or relative change percentage for the upper band.
Down: Indicates the probability or relative change percentage for the lower band.
Table Rows: There are two main rows of interest:
P%: Shows the price change percentage difference between the bands and the closing price. A positive value in the "Up" column suggests the upper band is above the current close, indicating potential upward momentum. Conversely, a negative value in the "Down" column suggests downward momentum.
R%: Displays the relative inner change percentage difference between the bands, offering a measure of the market's volatility or stability within the bands.
Utilizing the Insights
Market Trends: A widening gap between the "Up" and "Down" percentages in the "P%" row might indicate increasing market volatility. Traders can use this information to adjust their risk management strategies accordingly.
Entry and Exit Points: The "R%" row provides insights into the relative position of the current price within the probability bands. Traders might consider positions closer to the lower band as potential entry points and positions near the upper band as exit points or take-profit levels.
Conclusion
The Nadaraya-Watson Probability script offers a sophisticated tool for traders looking to incorporate statistical analysis into their trading strategy. By understanding and utilizing the data presented in the script's table, traders can gain insights into market trends and volatility, aiding in decision-making processes. Remember, no indicator is foolproof; always consider multiple data sources and analyses when making trading decisions.

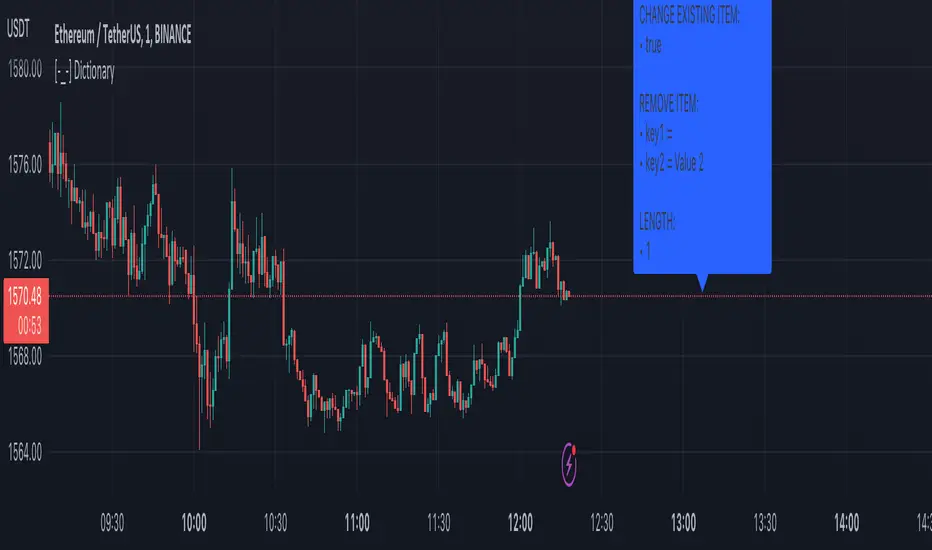
[-_-] DictionaryThe script shows an example implementation of dictionary-like data type which can store key:value pairs (Python style). Both keys and values can have any of the following type:
• string
• integer
• float
• boolean
• color
You can add items of different types to the same dictionary (e.g. key = 12 and value = "value" stored in the same dictionary with key = "key" and value = 0.23).
Under the hood dictionary is a custom Object (see www.tradingview.com), that has two array fields (one for storing keys, another for storing values). Keys and values of different types are converted into a string representation when adding a new item to the dictionary. The value is then converted back to certain type (bool/color/etc.) from that string representation when being retrieved. Script also utilises the new Methods (see www.tradingview.com).
The following methods are implemented:
• init() -> initialises the array fields of dictionary (without this the script throws an error "Array methods can't be called when ID of array is na"
• set(key, value) -> add a new item to dictionary; if an item for given key already exists - change it to new value
• getS(key) -> get value of string type
• getI(key) -> get value of integer type
• getF(key) -> get value of float type
• getB(key) -> get value of boolean type
• getC(key) -> get value of color type
• remove(key) -> removes item from dictionary
• len() -> get length of dictionary (the number of keys)
I could not make just one "get" function that returns any type of value (color/string/etc.), so instead I created a get function for each value type. Example usage:
• you add a string item: dictionary.set(2, "string here")
• you add a float item: dictionary.set(3, 24.56)
• to retrieve first value (key=2) do this: dictionary.getS(2)
• to retrieve second value (key=3) do this: dictionary.getF(3)
Darvas Box + Infobox 52W High/LowThe script draws Darvasboxes and outputs trend arrows.
The script additionally contains the following values in an info box:
* the price of the absolute high within the last 52 weeks and its distance in days
* the price of the absolute low within the last 52 weeks and its increase in % to date
* the current course
Variable are:
-Darvas logic: strictly according to Darvas or more flexible, i.e. with more info boxes, but also with more false boxes
- the number of weeks
- the location of the info box (top right, middle right, bottom right)
- the font size of the info box
- the display of the current course
This script is for illustrative purposes only and does not make any trading recommendations.
Thanks to © danilogalisteu, who provided me with his v5 script the template for the more flexible version of the Darvas boxes

Enhanced BTC Order Block IndicatorThe script you provided is an "Enhanced BTC Order Block Indicator" written in Pine Script v5 for TradingView. It is designed to identify and visually mark Order Blocks (OBs) on a Bitcoin (BTC) price chart, specifically tailored for a high-frequency scalping strategy on the 5-minute (M5) timeframe. Order Blocks are key price zones where institutional traders are likely to have placed significant buy or sell orders, making them high-probability areas for reversals or continuations. The script incorporates customizable filters, visual indicators, and alert functionality to assist traders in executing the strategy outlined earlier.
Key Features and Functionality
Purpose:
The indicator detects bullish Order Blocks (buy zones) and bearish Order Blocks (sell zones) based on a predefined percentage price movement (default 0.5–1%) and volume confirmation.
It marks these zones on the chart with colored boxes and provides alerts when an OB is detected.
User-Configurable Inputs:
Price Move Range: minMovePercent (default 0.5%) and maxMovePercent (default 1.0%) define the acceptable price movement range for identifying OBs.
Volume Threshold: volumeThreshold (default 1.5x average volume) ensures OB detection is backed by significant trading activity.
Lookback Period: lookback (default 10 candles) determines how many previous candles are analyzed to find the last candle before a strong move.
Wick/Body Option: useWick (default false) allows users to choose whether the OB zone is based on the candle’s wick or body.
Colors: bullishOBColor (default green) and bearishOBColor (default red) set the visual appearance of OB boxes.
Box Extension: boxExtension (default 100 bars) controls how far the OB box extends to the right on the chart.
RSI Filter: useRSI (default true) enables an RSI filter, with rsiLength (default 14), rsiBullishThreshold (default 50), and rsiBearishThreshold (default 50) for trend confirmation.
M15 Support/Resistance: useSR (default true) and srLookback (default 20) integrate M15 timeframe swing highs and lows for additional OB validation.
Core Logic:
Bullish OB Detection: Identifies a strong upward move (0.5–1%) with volume above the threshold. It then looks back to the last bearish candle before the move to define the OB zone. RSI > 50 and proximity to M15 support/resistance (optional) enhance confirmation.
Bearish OB Detection: Identifies a strong downward move (0.5–1%) with volume confirmation, tracing back to the last bullish candle. RSI < 50 and M15 resistance proximity (optional) add validation.
The OB zone is drawn as a rectangle from the high to low of the identified candle, extended rightward.
Visual Output:
Boxes: Uses box.new to draw OB zones, with left set to the previous bar (bar_index ), right extended by boxExtension, top and bottom defined by the OB’s high and low prices. Each box includes a text label ("Bullish OB" or "Bearish OB") and is semi-transparent.
Colors distinguish between bullish (green) and bearish (red) OBs.
Alerts:
Global alertcondition definitions trigger notifications for "Bullish OB Detected" and "Bearish OB Detected" when the respective conditions are met, displaying the current close price in the message.
Helper Functions:
f_priceChangePercent: Calculates the percentage price change between open and close prices.
isNearSR: Checks if the price is within 0.2% of M15 swing highs or lows for support/resistance confluence.
How It Works
The script runs on each candle, evaluating the current price action against the user-defined criteria.
When a bullish or bearish move is detected (meeting the percentage, volume, RSI, and S/R conditions), it identifies the preceding candle to define the OB zone.
The OB is then visualized on the chart, and an alert is triggered if configured in TradingView.
Use Case
This indicator is tailored for your BTC scalping strategy, where trades last 1–15 minutes targeting 0.3–0.5% gains. It helps traders spot institutional order zones on the M5 chart, confirmed by secondary M1 analysis, and integrates with your use of EMAs, RSI, and volume. The customizable settings allow adaptation to varying market conditions or personal preferences.
Limitations
The M15 S/R detection is simplified (using swing highs/lows), which may not always align perfectly with manual support/resistance levels.
Alerts depend on TradingView’s alert system and require manual setup.
Performance may vary with high volatility or low-volume periods, necessitating parameter adjustments.

Kaito Box with RSI Div(Dynamic Adjustment + MA + Long)The script implements a dynamic trading strategy that combines box range detection, RSI divergence signals, and moving average trend analysis. It is designed for use on OKX Signal Bots and includes features for dynamic position scaling and partial position closing. Below is a summary of its key functionalities:
Key Features:
Box Range Detection:
The script identifies price ranges using the highest high and lowest low of a configurable boxLength period.
These levels are plotted on the chart to visualize the price range.
RSI Divergence Detection:
The script calculates RSI using a configurable rsiLength.
Detects bullish divergence when price makes a lower low, but RSI makes a higher low.
Detects bearish divergence when price makes a higher high, but RSI makes a lower high.
Includes separate left and right lookback periods (leftLookback, rightLookback) for precise local extrema detection.
Customizable Moving Averages:
Supports multiple types of Moving Averages (SMA, EMA, SMMA, WMA, VWMA).
Calculates and plots MA20, MA50, MA100, and MA200 on a user-defined timeframe (custom_timeframe).
Identifies uptrends and downtrends based on the alignment of the moving averages and price levels.
Dynamic Position Scaling:
Implements dynamic position sizing for long entries and partial position closing for exits.
The percentage of position size added or closed is based on the difference between the current price and the average position price (avgPrice), with configurable minimum thresholds (minEnterPercent, minExitPercent).
Signal Integration for OKX Bots:
Sends buy/sell signals to OKX Signal Bots using the configured signalToken.
Supports market or limit orders with configurable price offsets and investment types.
Trend-Based Signal Filtering:
Only triggers long signals during downtrends and short signals during uptrends, ensuring trades align with the overall market context.
Visual Annotations:
Plots bullish and bearish divergence signals on the chart.
Displays labels showing dynamic position size adjustments and current average price during trades.
How It Works:
Long Signals:
Triggered when the price breaches the lower box range, and a bullish RSI divergence is detected.
Additional filtering ensures long trades are executed only during downtrend conditions.
Dynamically adjusts the position size based on the price difference from the average entry price.
Short Signals:
Triggered when the price breaches the upper box range, and a bearish RSI divergence is detected.
Additional filtering ensures short trades are executed only during uptrend conditions.
Dynamically closes portions of the position based on price movement relative to the average entry price.
Alerts:
Generates actionable alerts formatted for OKX bots, including order type, signal token, and dynamically calculated position sizes.
Use Case:
This strategy is well-suited for automated trading on platforms like OKX, where it can:
Exploit price ranges and RSI divergences for precise entries and exits.
Dynamically manage position sizes to optimize risk-reward.
Adapt to different market conditions using configurable parameters like moving averages, divergence lookbacks, and trend filters.
This script provides a robust foundation for traders looking to automate their strategies while maintaining flexibility and control over their trading logic.

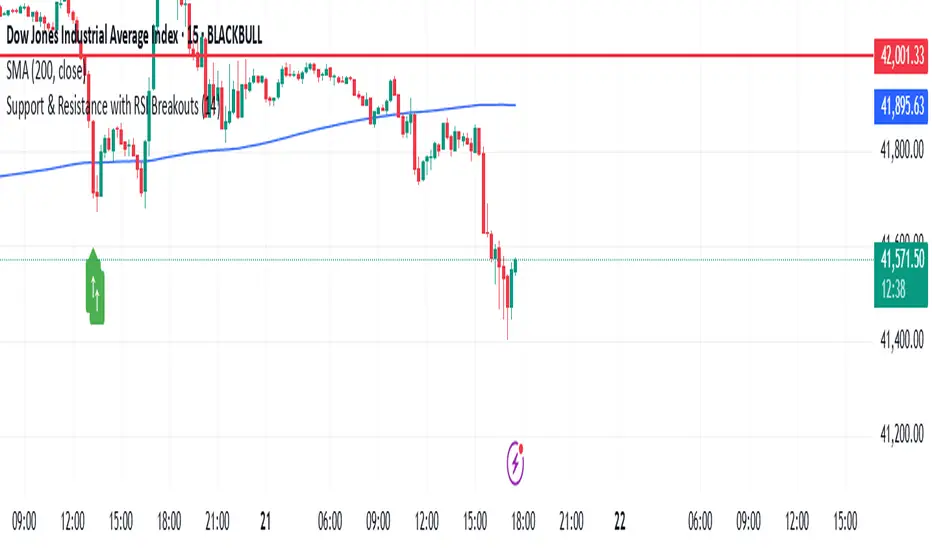
Support & Resistance with RSI BreakoutsThe script is a TradingView Pine Script (v5) indicator that identifies support and resistance levels using RSI (Relative Strength Index) breakouts. Here’s a breakdown of what it does:
Features:
RSI Calculation:
The script calculates the 14-period RSI (default) using the closing price.
The user can modify the RSI period through an input setting.
Buy and Sell Signals:
A buy signal is triggered when RSI drops below 20 (indicating oversold conditions).
A sell signal is triggered when RSI rises above 80 (indicating overbought conditions).
Visual Representation:
Buy signals are marked with a green upward arrow (↑) below the price bars.
Sell signals are marked with a red downward arrow (↓) above the price bars.
The arrows help traders easily spot potential trade opportunities.
Usage:
This script is useful for traders looking to buy at oversold conditions and sell at overbought conditions based on RSI.
It works best when combined with other indicators or price action strategies to confirm signals.
ICT Sessions_One Setup for Life [MK]The script plots the High/Low of the following trading sessions:
London - 02:00-05:00
NY AM - 09:30-12:00
New York Lunch - 12:00-13:30
New York PM - 13:30-16:00
Due to the high level of liquidity (resting orders), highs and lows of these sessions may be used as buy/sell areas and also as profit target areas. Typically, buy orders would be initiated below a session low and sell orders would be initiated above a
session high.
The script also plots 'RTH (Regular Trading Hours) Opening Gaps'. The RTH gaps are drawn from the closing price of regular trading at 16:15 (EST) to the open price of regular trading at 09:30 (EST). Gaps can be areas that traders might anticipate to be filled at some time in the future. A gap 'midline' is available if needed and yesterday RTH close line can be shown and extended to the current bar.
This script is simply a means to draw boxes around certain areas/periods on the charts. It is in no way a trading strategy and users should spend much time to study the concept and should also perform extensive back-testing before taking any trades.
By setting the lookback value to a much higher value then the default of 6, users can utilise the script to perform their own backtesting studies.
The above chart shows the default setup of the indicator. Note that the user has to choose how far (in days) to lookback and draw the sessions/gaps.
It is also possible to show the session high//low lines and extend them to the current bar time. If this is used it is advised to keep the lookback period as low as possible to ensure charts stay clean/uncluttered.
All boxes/lines styles/colors are fully customisable.

Data structure map[string, float]The script shows a workaround for map in pine-script via drawings.
There are few restrictions with them:
1. The size of the map cannot be more that amount of allowed drawings (about 40 by now)
2. Because the map shares the space of drawings throughout the whole script, using drawings with the map must be careful, with handly creating and removing of each drawing, because otherwise pine's garbage collector might break the stack. I'd recommend not using more drawings with the map.
3. setters and getters must be called on every bar, because of implementation of functions in pine there are inner serieses, which must be updated on every bar. So wherever you have a setter or getter in the code - it must be called on every bar. But if it's just an update, then you should pass 'false' as a param of the funtion.
The script shows a way to work with the map: filling it with some tickers and values for each of it and then plot the value if the symbol on the chart equals to one of the tickers in the map.
And there are some examples of updating of the value and removing of the item from the map.

Workaround for Arrays in pine and Bubble sortThe script shows a workaround for arrays in pine-script via drawings.
There are few restrictions with them:
1. The length of the array cannot be more that amount of allowed drawings (about 40 by now)
2. Because the "array" shares the space of drawings throughout the whole script, using drawings with the "array" must be careful, with handly creating and removing of each drawing, because otherwise pine's garbage collector might break the "array"
3. Getter and Setter must be called on every bar, because of implementation of functions in pine there are inner serieses, which must be updated on every bar. So wherever you have a setter or getter in the code - it must be called on every bar. But if it's just an update, then you should pass 'false' as a param of the funtion.
The script also shows an example of implementation of bubble sort of the array in pine: when the array have been created, it's filled with pseudo-random numbers and sorted on every bar. There are plotting of the array's numbers before/after soring to show the sorting result.

Big Trades [Volume Anomalies] (Enhanced)The script is a **volume-anomaly “big trades” detector** for futures that tries to (1) split each candle’s volume into a **buy-pressure** and **sell-pressure** estimate, (2) flag **statistically extreme** candles (tiers), and (3) optionally label those extremes as **initiative (follow-through)** vs **absorbed (no follow-through)** using a forward-style confirmation window.
Here’s what it does, piece by piece.
---
## 1) What it’s trying to detect
It’s not true “whale prints” or real bid/ask delta. It detects:
* **unusually large participation** (volume anomaly)
* with a **directional guess** (buy-ish vs sell-ish)
* and then checks whether price **continued** after that anomaly
So it’s: **“big participation + did it work?”**
---
## 2) The “buy vs sell volume” estimate
For each candle, it builds a **weight** for buy and sell pressure:
* **close location within the candle**
* close near high → more buy weight
* close near low → more sell weight
* **body direction (close–open)**
* bullish body adds buy boost
* bearish body adds sell boost
Then it computes:
* `raw_buy = volume * buy_weight`
* `raw_sell = volume * sell_weight`
This is an **OHLC-based proxy** for pressure, not real aggressor volume.
---
## 3) Normalization (makes it behave across sessions)
If enabled, it divides by ATR:
* `norm_buy = raw_buy / ATR`
* `norm_sell = raw_sell / ATR`
This helps a lot on futures because volume/volatility regimes differ between Asia/London/NY.
---
## 4) Statistical anomaly detection (z-score logic)
It calculates “what’s normal” using the last `lookback` bars, but **uses ` `** so the current bar doesn’t contaminate the stats (reduces flicker):
* `avg_buy = sma(norm_buy, lookback) `
* `std_buy = stdev(norm_buy, lookback) `
(and same for sell)
Then it computes **z-scores**:
* `z_buy = (norm_buy - avg_buy) / std_buy`
* `z_sell = (norm_sell - avg_sell) / std_sell`
If z-score crosses thresholds, it triggers tiers:
* Tier 1: `sigma`
* Tier 2: `sigma + tier_step1`
* Tier 3: `sigma + tier_step2`
So **Tier 3 = “big bubble”**.
---
## 5) Optional VWAP bias filter
It computes VWAP correctly as:
* `vwapv = ta.vwap(hlc3)`
If enabled:
* buys only when `close >= vwap`
* sells only when `close <= vwap`
This is just a **trend/bias filter** to reduce counter-trend bubbles.
---
## 6) Plotting (how bubbles appear)
It places markers at:
* buys around `(close+low)/2` (lower-ish)
* sells around `(close+high)/2` (upper-ish)
And draws:
* small/medium/large circles (depending on tier)
* with optional INIT/ABS overlays (explained next)
---
## 7) “Initiative vs Absorbed” classification (the smart part)
Because Pine can’t see the future on the same bar, your script does a **delayed evaluation**:
* It waits `N = confirm_bars`
* Looks at what happened from the signal bar to the current bar
* Decides if price moved far enough in the intended direction
It uses:
* `hh_window = highest(high, N+1)`
* `ll_window = lowest(low, N+1)`
(these cover the last N+1 bars: from signal bar to now)
Then it measures follow-through:
* For a buy signal N bars ago:
`buy_move = hh_window - high `
* For a sell signal N bars ago:
`sell_move = low - ll_window`
It compares to an ATR-based threshold anchored to the signal bar:
* `thr_move_sig = ATR * move_mult_atr`
If move > threshold → **INIT**
Else → **ABS**
Then it **plots back onto the original signal bar** using `offset=-N` so it visually marks the candle that caused it.
To make it obvious:
* **INIT** = circle
* **ABS** = X
This part is “accurate” in the sense that it’s purely **price-outcome based**.
---
## 8) Labels (optional)
If enabled, it prints labels on those large signals with:
* INIT/ABS
* the z-score at the signal bar
* and a “delta proxy” (`norm_buy - norm_sell`), not true delta
---
## In one sentence
The script flags **statistically extreme volume-pressure candles** (buy/sell proxy), and then classifies those extremes as **worked (initiative)** or **failed (absorbed)** based on **subsequent price movement** within `confirm_bars`.

Day Color CandlesThe script uses TradingView’s built-in dayofweek value (where Monday = 1 and Sunday = 7) to detect the current bar’s weekday.
For each weekday, a specific color is assigned — green for Monday, blue for Tuesday, purple for Wednesday, orange for Thursday, yellow for Friday, gray for Saturday, and red for Sunday.
Instead of plotting new candles, the script uses barcolor() to recolor the existing chart candles. This avoids conflicts with TradingView’s rule that a script may contain only one main declaration. The price data remains unchanged — only the visual appearance of the candles is modified to help the user visually separate trading days.

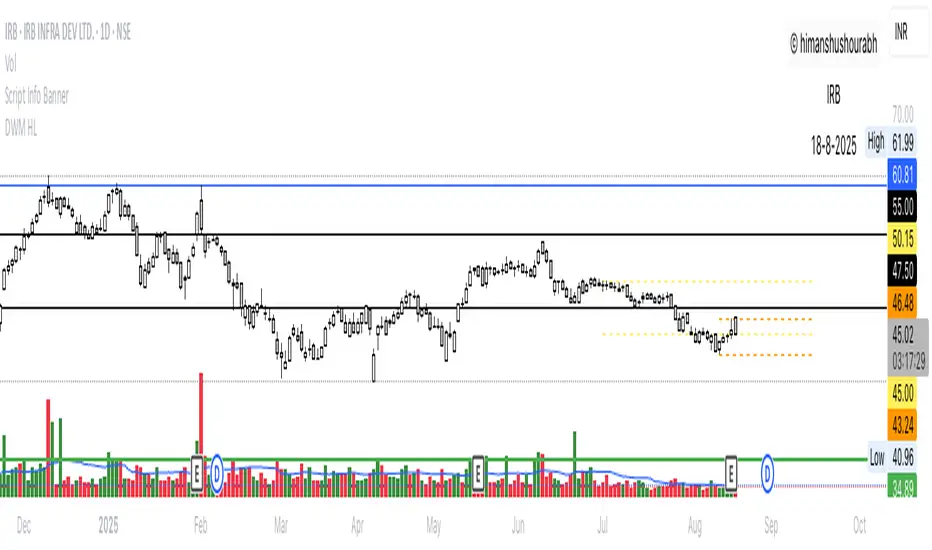
Script Info BannerThe script includes a small template displaying the username, script name, and date of analysis. This feature is implemented to establish credibility and prevent unauthorized use of the analysis.
BySq - Market PsychologyThe script I provided is a Market Psychology Index indicator for TradingView, which focuses on three key psychological market phases:
FOMO (Fear of Missing Out)
Panic Selling
Reversal
This indicator uses volume, price changes, and specific time periods to gauge market sentiment. Let me break it down:
1. Input Parameters:
FOMO Period: Defines how many bars (candles) the FOMO index will consider for its calculation.
Panic Period: Defines the period to evaluate Panic Selling.
Reversal Period: Defines the period to evaluate potential price reversals.
You can adjust these periods based on your analysis preferences. The default for each period is 14.
2. FOMO Index:
The FOMO Index aims to capture the "fear of missing out" behavior in the market.
It uses volume and price change:
Volume is compared to the Simple Moving Average (SMA) of volume over the specified period.
Price change is calculated as the percentage change in price compared to the previous bar.
If both volume and price change indicate strong upward movement, the FOMO index spikes.
3. Panic Selling Index:
The Panic Selling Index captures when traders are selling out of fear, often in a rapid or irrational way.
Similar to the FOMO Index, it considers volume and price change:
It uses volume and compares it to the SMA of volume for the panic period.
Price change is negative, meaning it considers only price drops.
When there is high volume coupled with significant price drops, it signals panic selling.
4. Reversal Index:
The Reversal Index aims to detect potential trend reversals in the market.
This index also considers volume and price change:
It focuses on upward price movement and compares volume to its SMA.
If there’s strong upward price movement along with increasing volume, it signals the possibility of a price reversal.
5. Graphical Output:
Histograms are drawn on the chart for each of the three indices:
FOMO is shown in green (indicating the presence of FOMO) and red (when the index is low).
Panic Selling is shown in orange.
Reversal is shown in purple.
The Zero Line (horizontal dotted line) helps identify when any of the indices is positive or negative.
6. Labels:
Labels for each index are shown on the chart at the relevant bar when the index spikes.
FOMO is labeled "FOMO" in green when it spikes.
Panic Selling is labeled "Panic Selling" in orange when it spikes.
Reversal is labeled "Reversal" in purple when it spikes.
Additionally, period labels show above the chart, indicating the specific periods (FOMO, Panic, and Reversal periods) currently being applied. This provides clarity on what time frame each index is analyzing.
7. How to Use:
FOMO: High values may indicate that traders are buying out of fear of missing out on a rally, suggesting a potentially overheated market.
Panic Selling: High values could suggest irrational selling behavior or capitulation, potentially marking the bottom of a downtrend.
Reversal: High values signal the potential for a market reversal, where the price could change direction due to increased volume and upward movement.
8. Visual Appearance:
The indicator’s histograms change colors based on the level of market sentiment detected. The color-coded approach provides an easy-to-read visual representation of different psychological phases in the market.
The horizontal zero line allows easy differentiation between positive and negative values.
Summary:
This script combines the psychology of the market (FOMO, Panic Selling, and Reversal) into a set of indicators that help traders identify potential turning points or emotional states in the market. By focusing on volume and price change, the script attempts to give a clear picture of market sentiment and possible future movements.

Stock Earnings Viewer for Pine ScreenerThe script, titled "Stock Earnings Viewer with Surprise", fetches actual and estimated earnings, calculates absolute and percent surprise values, and presents them for analysis. It is intended to use in Pine Screener, as on chart it is redundant.
How to Apply to Pine Screener
Favorite this script
Open pine screener www.tradingview.com
Select "Stock Earnings Viewer with Surprise" in "Choose indicator"
Click "Scan"
Data
Actual Earnings: The reported earnings per share (EPS) for the stock, sourced via request.earnings().
Estimated Earnings: Analyst-predicted EPS, accessed with field=earnings.estimate.
Absolute Surprise: The difference between actual and estimated earnings (e.g., actual 1.2 - estimated 1.0 = 0.2).
Percent Surprise (%): The absolute surprise as a percentage of estimated earnings (e.g., (0.2 / 1.0) * 100 = 20%). Note: This may return NaN or infinity if estimated earnings are zero, due to division by zero.
Practical Use
This screener script allows users to filter stocks based on earnings metrics. For example, you could screen for stocks where Percent Surprise > 15 to find companies exceeding analyst expectations significantly, or use Absolute Surprise < -0.5 to identify underperformers.

Aggregation BTC CVDThe script calculates the Cumulative Volume Delta (CVD) for multiple cryptocurrency exchanges, then averages these values and plots them.
Indicator Setup:
The script sets up an indicator called "BTC Cumulative Volume Delta (CVD) for multiple cryptocurrency exchanges", displayed as a separate panel (not overlaid on the price chart) with volume format.
Getting 1-minute data from multiple exchanges:
It retrieves 1-minute data (buy and sell volumes) for Bitcoin (BTC) against USD or USDT from several exchanges: Binance, OKEx, Coinbase (both BTCUSDT and BTCUSD), Bitfinex, Bybit, Huobi, and Kraken.
Calculating total buying and selling volume for each exchange:
For each exchange, it calculates the total buying volume (buy_vol_...), selling volume (sell_vol_...), and the difference between them (delta_vol_...).
It then computes the cumulative delta volume (cum_delta_vol_...), which is a running total of delta_vol_....
Calculating the average CVD:
It calculates the average cumulative delta volume (average_cum_delta_vol) by summing the cumulative delta volumes from all exchanges and dividing by the number of exchanges.
Plotting the average CVD:
Finally, it plots the average CVD with white color, and a line width of 2.
This script essentially provides an averaged Cumulative Volume Delta across multiple exchanges, giving a comprehensive view of buying and selling pressure in the Bitcoin market across these platforms.

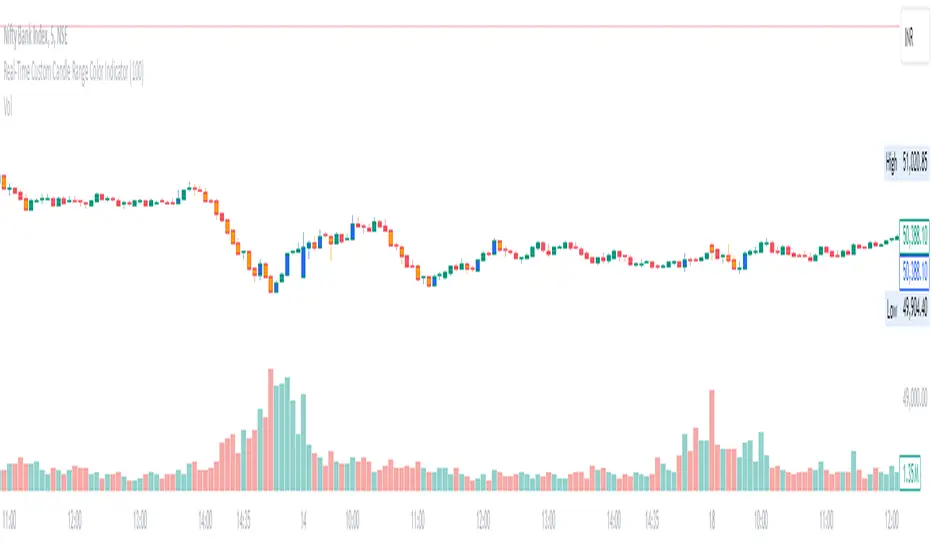
Real-Time Custom Candle Range Color Indicator
The script allows the user to input a custom range value (default set to 100 points) through the userDefinedRange variable. This value determines the minimum range required for a candle to change color.
Calculating Candle Range:
The script calculates the range of each candle by subtracting the low from the high price.
Determining Bullish or Bearish Candles:
It checks whether the close price is higher than the open price to determine if a candle is bullish (isBullish variable).
Coloring Candles:
Based on the custom range input, the script changes the color of the candles:
If the candle's range is greater than or equal to the custom range and it is bullish, the candle color is set to blue (bullishColor).
If the range condition is met and the candle is bearish, the color is set to orange (bearishColor).
If the range condition is not met, the color is set to na (not applicable).
Plotting Colored Candles:
The plotcandle function is used to plot candles with colors based on the custom range and bullish/bearish conditions. The candles will have a higher z-order to be displayed in front of default candles.
Displaying High and Low Price Points:
Triangular shapes are plotted at the high and low price levels using the plotshape function, with colors representing bullish (blue) and bearish (orange) conditions.
In trading, this indicator can help traders visually identify candles that meet a specific range criteria, potentially signaling strength or weakness in price movements. By customizing the range parameter, traders can adapt the indicator to different market conditions and trading strategies. It can be used in conjunction with other technical analysis tools to make informed trading decisions based on candlestick patterns and price movements.
Stochastic RSI OHLC StrategyThe script titled "Stochastic RSI High Low Close Bars" is a versatile trading strategy implemented in Pine Script, designed for TradingView. Here's an overview of its features:
Description
This strategy leverages the Stochastic RSI to determine entry and exit signals in the market, focusing on high, low, and close values of the indicator. It incorporates various trading styles, stop-loss mechanisms, and multi-timeframe analysis to adapt to different market conditions.
Key Features
Stochastic RSI Analysis:
Uses the Stochastic RSI to identify potential entry points for long and short positions.
Tracks high, low, and close values for more granular analysis.
Multiple Trading Styles:
Supports diverse trading styles like Volume Color Swing, RSI Divergence, RSI Pullback, and more.
Allows switching between these styles to suit market dynamics.
Session-Based Trading:
Offers session control, limiting trades to specific hours (e.g., NY sessions).
Can close all positions at the end of the trading day.
Stop-Loss and Take-Profit Mechanisms:
Includes both static and dynamic stop-losses, with options for time-based stops, trailing stops, and momentum-based exits.
Customizable take-profit levels ensure efficient trade management.
Volume Analysis:
Integrates volume indicators to add a bias for trade entries and exits, enhancing signal reliability.
Multi-Timeframe Integration:
Employs multi-timeframe RSI analysis, allowing the strategy to capture broader trends and optimize entries.
This script is designed to provide flexibility and adaptability, making it useful for different trading strategies and market conditions. It is suitable for traders looking to refine their entries and exits with a focus on the Stochastic RSI.
